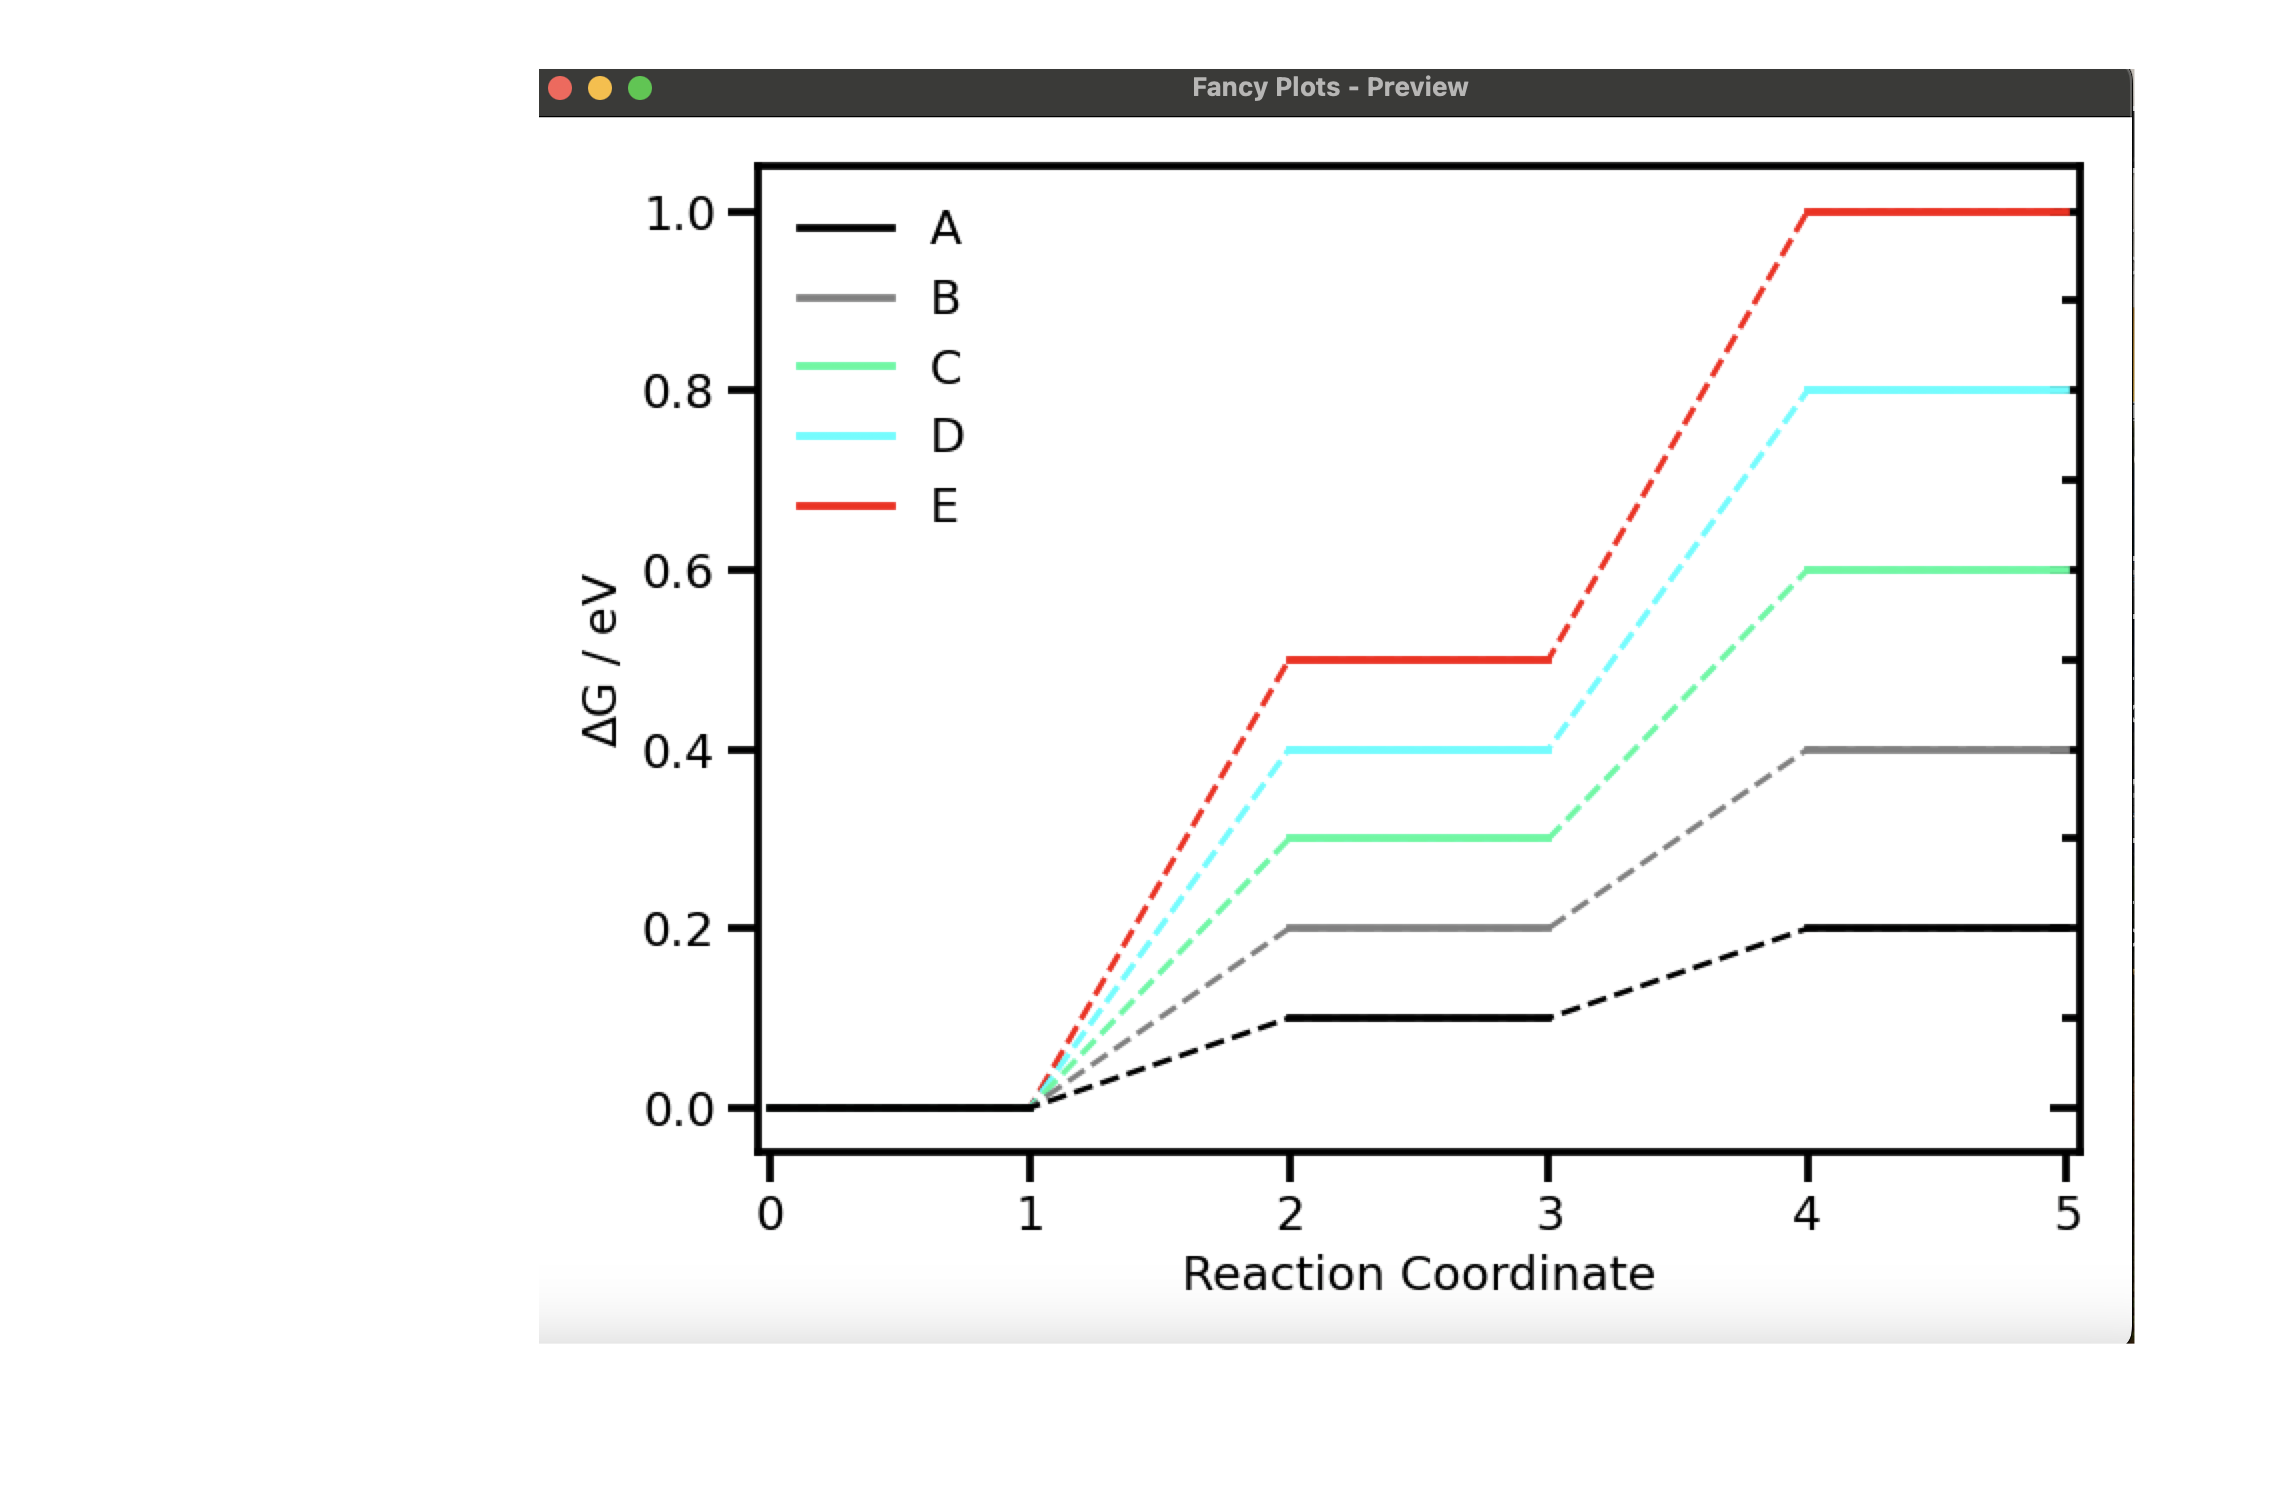
Creating Free Energy Diagrams
ccu features a GUI utility, FancyPlots, for creating free energy diagrams for
mechanistic studies.
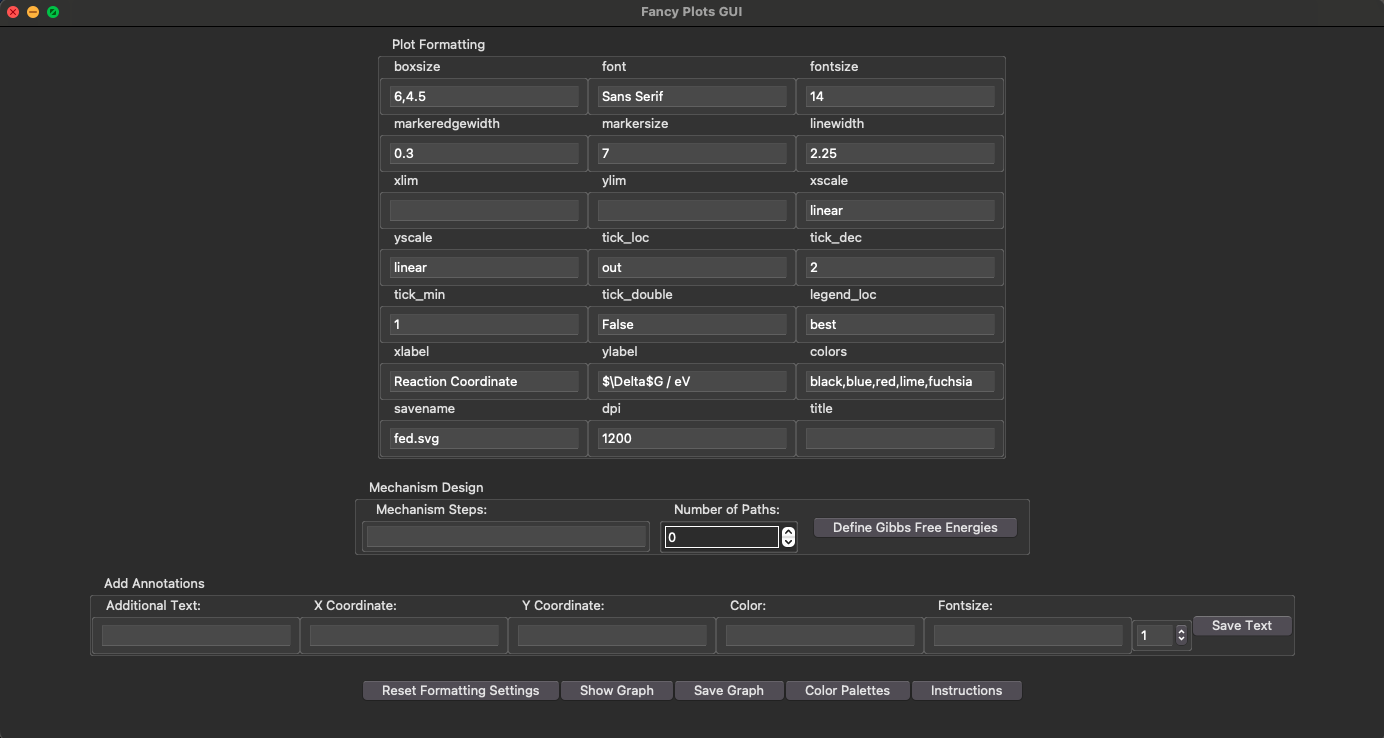
Using the GUI
FancyPlots can be launched from the command line via the ccu fed subcommand:
ccu fed
or by the ccu.fancyplots subpackage:
import tkinter as tk
from ccu.fancyplots import FancyPlotsGUI
root = tk.Tk()
app = FancyPlotsGUI(master=root)
app.master.mainloop()
With FancyPlots, you can design reaction mechanisms, define their reaction energies, modify plotting parameters, and save the free energy diagram.
FancyPlots produces a cache file (extension .fancy) that can be used to
initialize FancyPlots with the values from a previous session. To seed FancyPlots
with data from a previous session run:
ccu fed --cache=CACHE_FILE
from the command line or
import tkinter as tk
from ccu.fancyplots. import FancyPlotsGUI
root = tk.Tk()
app = FancyPlotsGUI(cache_file=Path("CACHE_FILE"), master=root)
app.master.mainloop()
within Python.
Tip
The cache file contains the information required to
re-populate all the FancyPlots data. (For more details about this information,
see the ccu.fancyplots.data.FEDData class.) Sometimes, however, you
may only have mechanistic data that you would like to use to initialize
FancyPlots with. In this case, you can use the --data CLI option:
ccu fed --data=DATA_FILE
Creating Free Energy Diagrams Programatically
You can create free energy diagram without ever launching the GUI. Assuming
that you have the free energy diagram data saved in a file named
feddata.json, you can create an FED like so:
import json
from pathlib import Path

from ccu.fancyplots import DEFAULT_PARAMETERS, generate_figure

with Path("feddata.json").open(mode="r", encoding="utf-8") as file:
        data = json.load(file)

parameters = DEFAULT_PARAMETERS
parameters["savename"] = "saved_fed.svg"

ax1, ax2, fig = generate_figure(
        diagram_data=data,
        parameters=parameters,
        visual=False,
)